
Page 114 - Demo
P. 114
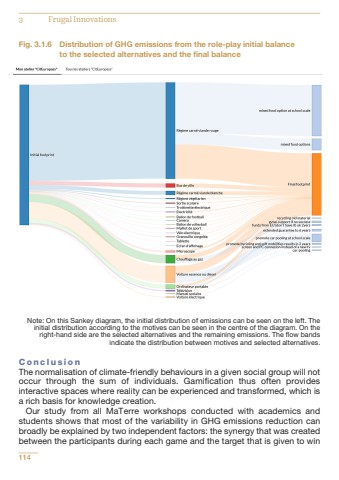
1143 Frugal InnovationsFig. 3.1.6 Distribution of GHG emissions from the role-play initial balance to the selected alternatives and the final balanceNote: On this Sankey diagram, the initial distribution of emissions can be seen on the left. Theinitial distribution according to the motives can be seen in the centre of the diagram. On theright-hand side are the selected alternatives and the remaining emissions. The flow bandsindicate the distribution between motives and selected alternatives.ConclusionThe normalisation of climate-friendly behaviours in a given social group will notoccur through the sum of individuals. Gamification thus often providesinteractive spaces where reality can be experienced and transformed, which isa rich basis for knowledge creation.Our study from all MaTerre workshops conducted with academics andstudents shows that most of the variability in GHG emissions reduction canbroadly be explained by two independent factors: the synergy that was createdbetween the participants during each game and the target that is given to win
