
Page 142 - Demo
P. 142
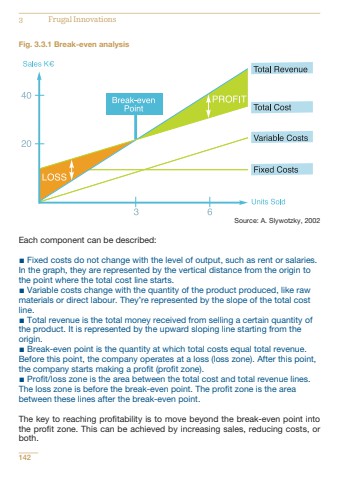
Fig. 3.3.1 Break-even analysisSource: A. Slywotzky, 2002Each component can be described:%u25aa Fixed costs do not change with the level of output, such as rent or salaries.In the graph, they are represented by the vertical distance from the origin tothe point where the total cost line starts.%u25aa Variable costs change with the quantity of the product produced, like rawmaterials or direct labour. They%u2019re represented by the slope of the total costline.%u25aa Total revenue is the total money received from selling a certain quantity ofthe product. It is represented by the upward sloping line starting from theorigin.%u25aa Break-even point is the quantity at which total costs equal total revenue.Before this point, the company operates at a loss (loss zone). After this point,the company starts making a profit (profit zone).%u25aa Profit/loss zone is the area between the total cost and total revenue lines.The loss zone is before the break-even point. The profit zone is the areabetween these lines after the break-even point.The key to reaching profitability is to move beyond the break-even point intothe profit zone. This can be achieved by increasing sales, reducing costs, orboth.1423 Frugal Innovations
